Telemonitoring of hydropower outside plant facilities
Case study at the Topolog water intake facility for the Vidraru-Arges hydropower plant
The management of Hidroelectrica Argeș and of the Vidraru-Argeș hydropower plant decided during summer 2011 to have a more precise view about what happens on the Topolog river, at one of the plant’s most important river water intake facility. In result of it, an Adcon (www.adcon.at) telemonitoring installation was put in service at the Topolog water intake facility by the BEIA crew, with considerable support provided by colleagues from Hidroelectrica.
Beginning from fall 2011, the Topolog telemonitoring system has continuously provided accurate data that have been used in daily water management activities, but also during some critical situations. You are invited to find below a short description of this system and of some of the situations that it has correctly and timely revealed.
1. Structure of the system
A river water intake facility consists of a dam across the river, plus a system of basins and channels. The purpose of such a construction is to take-in the river flow, to clean it of stones, sand and debris and to let it go through a gallery of appropriate capacity towards the main water accumulation which precedes the hydro power generators.
The monitoring equipment installed at the Topolog dam is working under the control of the data center (Gateway + Server) which is in operation 24/24 and 7/7 at the BEIA Consult headquarters in Bucharest.
Results of the data processing performed by the BEIA server are put on the Internet, where they are anytime and anywhere accessible for any user able to log in with valid name and password. Communication between the equipment installed at Topolog and the data center is achieved through the GSM-GPRS data service provided in the Topolog area by Vodafone Romania.
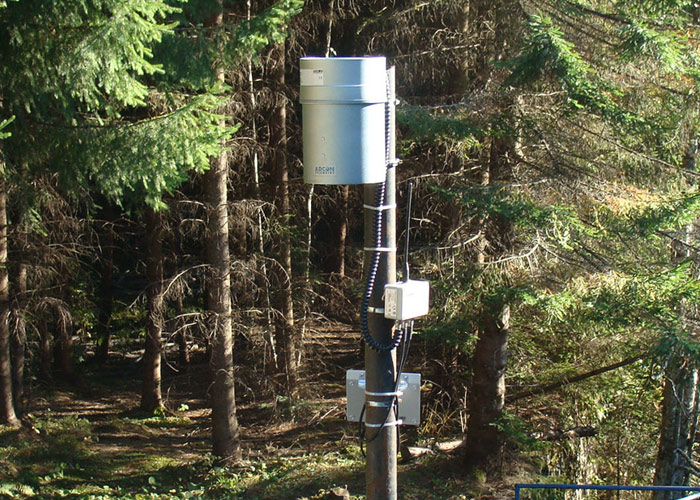
The equipment installed at the Topolog water intake facility consists of two distinct Adcon units powered each from own solar panel, namely:
– An Adcon A723 remote telemetry unit (RTU), operating in the UHF radio band of 430-440 MHz and installed on the river dam, in a point characterised by the absence of even the slightest trace of GSM signal. It is at this RTU that are connected the sensors able to measure all the parameters listed at point 2 of this presentation;
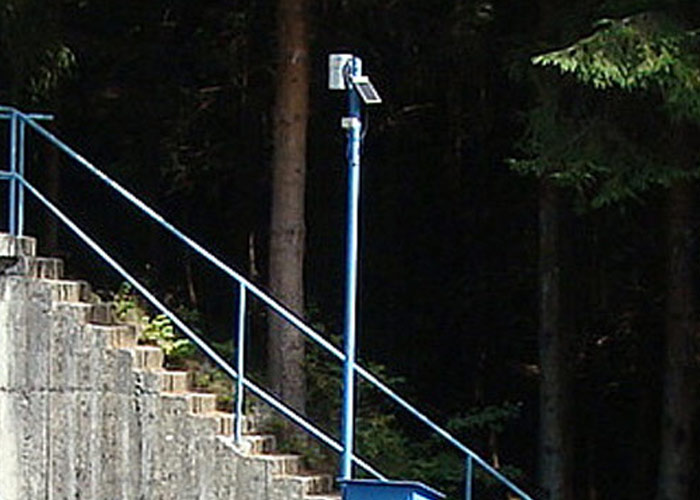
– An Adcon RA440 bridge station, which receives the data transmitted by the A723 RTU in UHF and retransmits them via GSM/GPRS to the data centre. Because of the long and difficult path to the GSM only tower that Vodafone has in the area, the bridge station was installed on a 30 meters high mast and equipped with a high-gain Yagi antenna. The distance of 150 m only between the A723 and the RA440 is being easily bridged by the 10 mW radio transmitter of the A723.
2. Measured parameters
By means of the sensors attached to the A723 RTU, the following parameters are continuously provided by the system:
2.1. Water intake flow under summer regime. In-taken water has during summer a way through the installation which is completely distinct from the way during winter, when water freezing must be avoided. Water flow is measured on the basis of water level in the final decantation basin and taking into account the geometry of the discharge threshold. A water level sensor with a range of only 0-150 cm is placed for this measurement at about 50 cm below the discharge threshold.
2.2. Water intake flow under winter regime. The measuring method is similar for the one used during summer, but the water level sensor with a range of 0-10 m is placed on the main dam, below the opening through which the water is in-taken during winter months.
2.3. Water level in the lake behind the dam. The water level probe referred at 2.2 is the one also measuring this parameter.
2.4. Air temperature. This parameter is reported by an A723 RTU built-in temperature sensor.
2.5. Precipitation intensity. For this parameter, a standard tipping-bucket Adcon aluminium rain gauge connected to the A723 is being used. The resolution of this sensor is of 0.2 mm.
2.6. Parameters obtained by integration (summation). For both types of flows, a simple mouse click and drag on the flow versus time screen diagram gives as its result the amount of water in-taken over a selected period of time. Using same method, the total rainfall can be obtained from the precipitation intensity diagram.
3. Detection of grate stuffing situations

A special application was created on the system’s server in order to timely detect grate stuffing situations, especially during spring floods and during heavy rain periods.
The application is based on the fact that the entire hydrodynamic system at the water intake installation has a stationary-type and perfectly predictable evolution. In other words , a given level in the lake behind the dam always corresponds to a certain normal (reference) in-taken flow (See the normal in-taken flow table). But this happens only as long as the water way from the lake to the discharge window is clear of any matter possibly stuffing the grates and channels. When stuffing appears, at a level of around 170 cm for instance (see table), in-taken flow decreases under 13,300 cubic meters / hour. And the system will issue acoustic alerts in the dispatcher room but also e-mail alerts towards predefined addresses as soon as the flow decreases under 12,000 cubic meters / hour, which is the flow that would have been normal for a level of 168 cm at the dam.
An example of how this application works is given is the diagram showing what happened at 26.04.2012.
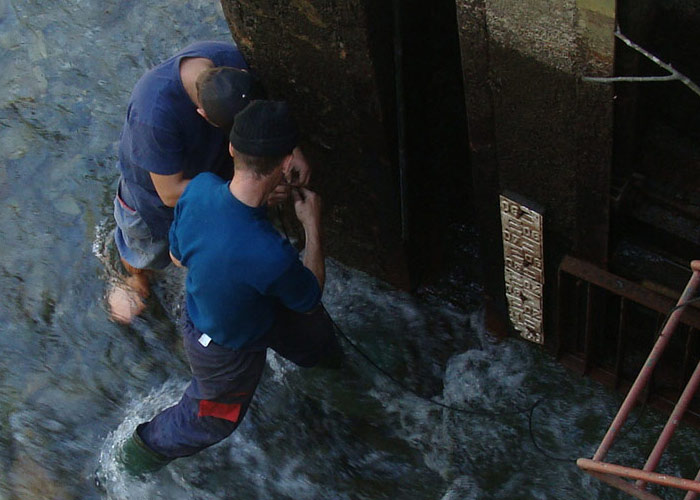
Images from installation site
Examples of diagrams (click on diagrams to enlarge)
On 15 March 2012, the installation was switched to the summer regime. The water level at the river dam was 1.51 m, while the in-taken flow was of 2,400 cubic meters / hour only.
On 26.04.2012 / 02.00 a severe stuffing process begun, which had as its result an in-taken flow of only about 4,270 cubic meters / h, while the water level in the lake reached 2.44 m. It was an emergency situation that was solved at 26.04.2012 / 08.00 by an intervention team. After the intervention, in-taken flow rapidly reached 40,000 cubic meters / h, which is the maximum flow that the gallery towards the main power plant can discharge.
Towards the end of May 2012, the lake level and in-taken flow have stabilised themselves to values of 1.80 m and 21,000 cubic meters / h. Significant spikes above these values were observed only during intense rain, as during the morning of 31.05.2012.
Due to prolonged drought, in September 2012, both lake level and in-taken flow are stabilised at very low values (1.54 m and 2,860 cubic meters / hour). On 11.09.2012, water intake process was interrupted for about 8 hours for some maintenance works.


